

Tableau Training · Philippines
Tableau Training in the Philippines
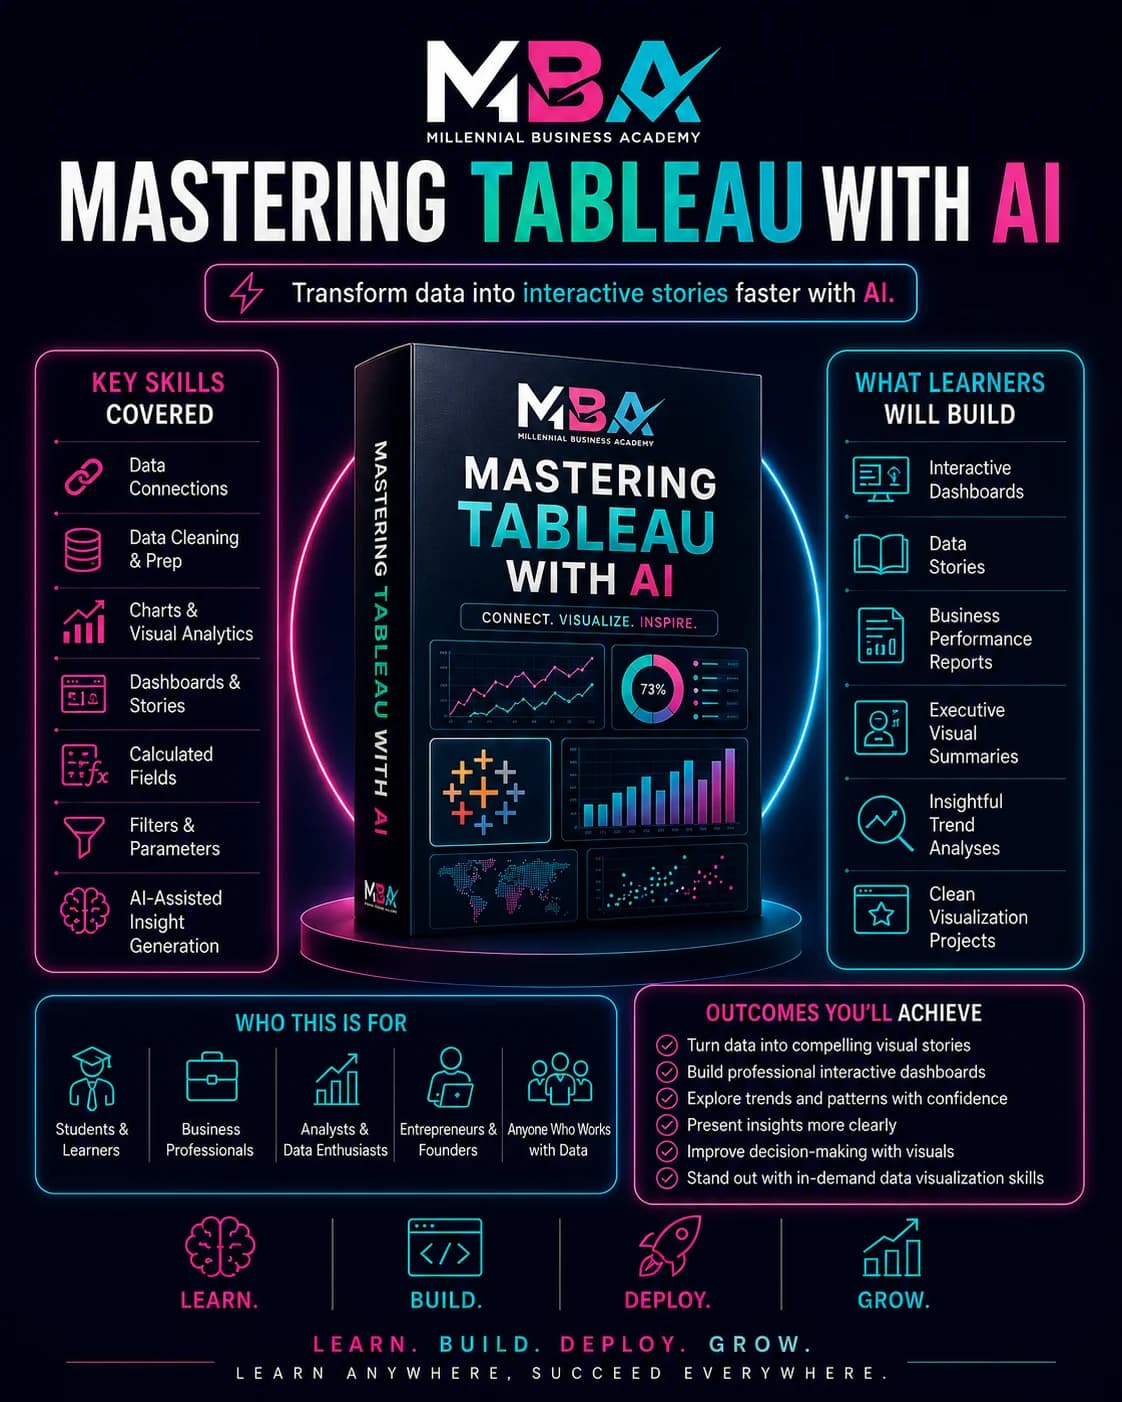
Tableau training in the Philippines, taught online for people who have never built a dashboard. Tableau is the point where your numbers stop being a spreadsheet nobody opens and start being something a manager can filter for themselves. It is covered inside the ₱6,000 AI-Powered Data Analytics Career Bootcamp, alongside Excel, SQL and Power BI. Before you pay anything, you can work through 3 free Tableau projects on this site, each with a real dataset and published answers to check yourself against.
Where can you learn Tableau in the Philippines?
Millennial Business Academy teaches Tableau online across the Philippines inside the ₱6,000 AI-Powered Data Analytics Career Bootcamp, which also covers Excel, SQL and Power BI. Sessions are live with recorded replays, and you can practice first with 3 free Tableau projects on this site before paying anything.
How long does it take to learn Tableau?
Your first Tableau dashboard is an afternoon of work: the 3 free Tableau projects here are scoped at 4 to 5 hours and 4 to 6 hours. Inside the ₱6,000 AI-Powered Data Analytics Career Bootcamp, Tableau sits alongside Excel, SQL and Power BI across 5 live sessions with recorded replays, ending in a published portfolio piece.
Quick facts
- Price
- ₱6,000 for the Career Bootcamp, paid once. ₱12,500 for the Career Bootcamp Premium. No hidden fees.
- Format
- Online, 5 live sessions with recorded replays. Nothing here requires you to be in Metro Manila.
- Tableau modules
- Data Visualization + AI and Tableau + AI
- Tools in the same path
- Excel, SQL, Power BI, Tableau, ChatGPT, Claude, and automation.
- Certificate
- Certificate of completion plus an AI badge. Numbers are 9 digits and verifiable at /verify.
- Free Tableau practice
- 3 projects, 6,034 rows of downloadable data, 12 graded questions. No payment.
- Starting level
- Computer literate. No degree, no IT background, no prior dashboard experience.
- Taught from
- Dasmariñas City, Cavite, delivered across the Philippines.
The Job It Does
What is Tableau actually used for in a Philippine workplace?
Tableau connects to a spreadsheet or a database and turns it into a page other people can click through on their own. That is the whole point: the reader stops emailing you for a cut of the numbers.
The pattern will be familiar if you work anywhere near data here. A regional sales pack goes out monthly as a workbook with dozens of tabs. A support team argues about which queue is breaching its SLA. A subscription business keeps signing people up and cannot say whether anyone stays. In all three the numbers already exist. What is missing is one page that answers the question and lets the reader filter it to their own branch, month or category without asking anybody.
That is the work Tableau does, and it is why it usually sits at the end of the analyst path rather than the start. You still need Excel to clean the file and SQL to pull the rows. Tableau is where the finished answer becomes something a VP will actually open. It also happens to be the easiest tool to show a hiring manager, because Tableau Public gives you a live URL instead of a screenshot in a PDF.
A concrete example
Build an executive sales dashboard for a retail chain
A personal-care retail chain operates across NCR, Luzon, Visayas, and Mindanao. The VP of Sales gets a 40-tab spreadsheet every month and reads none of it. You have twelve months of sales by region, province, and category, with targets. The ask: one interactive page that answers, at a glance, how are we doing versus target, where, and in what categories, with the December season clearly visible.
This is not a hypothetical. It is one of the free practice briefs below, with a 960 row dataset you can download and answer numbers you can check your dashboard against.
Open this briefInside The Bootcamp
What does the bootcamp cover for Tableau?
2 of the 7 components in the AI-Powered Data Analytics Career Bootcamp are the visualization work, and 3 course modules are where a Tableau workbook is built, finished and published.
Data Visualization + AI
₱1,500 separatelyThe thinking behind the chart: which view answers which question, what to leave out, and why a crowded dashboard usually says less than a sparse one.
Tableau + AI
₱1,500 separatelyThe tool itself: connecting to data, calculated fields, the chart types that survive an executive review, filters and dashboard actions, and publishing to a link.
Bought separately, the bundle breakdown lists them at ₱1,500 each. You do not buy them separately: all 7 components come in the ₱6,000 Career Bootcamp, paid once.
- IntermediateLive + replay
AI-Assisted Analytics Tools, Part 2
This is where the dashboard work sits. You take a business question, build the views that answer it, and lay them on one page instead of sending a folder of screenshots.
What this module covers - IntermediateProject + live feedback
Capstone Project and Personal Brand
The capstone is where a Tableau workbook stops being an exercise. One dataset, start to finish, into something you can put in front of a hiring manager.
What this module covers - IntermediateLive + replay
Career Readiness and Live Deployment
A dashboard nobody can open is not a portfolio. This is the publish step: a live, shareable link, and a straight answer ready for the interview question about what you built.
What this module covers
Free, No Payment
What free Tableau practice can you do right now?
3 Tableau briefs already live on this site, free, with 6,034 rows of downloadable data between them and published answer numbers so you can grade your own dashboard. 2 of them add a scored skills check of 12 questions.
- Intermediate
Build an executive sales dashboard for a retail chain
One page, four regions, twelve months: the interactive dashboard a VP actually reads.
- Time
- 4 to 5 hours
- Dataset
- 960 rows, free download
- Skills
- Connecting Tableau to a CSV, KPI cards and calculated fields (revenue versus target)
- Advanced6 graded questions
Build a cohort retention dashboard in Tableau
Order-level data in, a signup-cohort retention triangle out. This is the LOD-and-table-calc project that separates a chart-maker from an analyst.
- Time
- 4 to 6 hours
- Dataset
- 4,210 rows, free download
- Skills
- FIXED LOD expressions to derive each customer's first order, Cohort assignment and months-since-first-order with DATEDIFF
- Advanced6 graded questions
Rep quota and YoY analysis with Tableau LOD
Attainment as a ratio of sums, year-over-year as a table calc, share of total as a FIXED LOD: the three calculations executives ask for and analysts most often get subtly wrong.
- Time
- 4 to 6 hours
- Dataset
- 864 rows, free download
- Skills
- Attainment as SUM(revenue) over SUM(quota), avoiding the average-of-ratios trap, Year-over-year with a Percent Difference table calculation
Start with the intermediate one. Install the free Tableau Public app, download the CSV, and build the page the brief asks for. Then open the checkpoints at the bottom of the project and see whether your totals match. That last step is the part most free tutorials skip, and it is the difference between having watched Tableau and having used it.
Do all 3 and you will have published dashboards covering attainment against target, cohort retention, and quota with year over year, plus a live link for each one. You will also find out quickly whether you actually enjoy this, which is worth knowing before anyone spends money.
See all the free resourcesCompare
How much does Tableau training cost in the Philippines?
The 3 routes we publish, free one first. Sort any column. Every peso figure is read from the same catalog that sets the checkout amount, so nothing here can quote a price you will not actually be asked for.
| Free Tableau practice on this siteverified Sep 7, 2026 | ₱0no payment, no enrollment | ₱0 | Not published | 4 to 5 hours and 4 to 6 hours | Downloadable CSVs and published checkpoints you grade yourself. Nobody reviews your dashboard. | Tableau Public | Finding out whether you enjoy building dashboards at all | None |
|---|---|---|---|---|---|---|---|---|
| AI-Powered Data Analytics Career BootcampUsverified Sep 7, 2026 | ₱6,000one-time payment, all components included | ₱6,000 | Not published | 5 live sessions with recorded replays | Live online sessions with recorded replays | Tableau, Power BI, Excel, SQL, ChatGPT, Claude | Beginners who want Tableau inside the whole analyst path | AI badge and certificate of completion |
| AI-Powered Data Analytics Career Bootcamp PremiumUsverified Sep 7, 2026 | ₱12,500one-time payment, everything in the bootcamp | ₱12,500 | Not published | The bootcamp plus 4 months of recorded advanced training | Live online, replays, and self-paced recordings | Everything above, plus automation with n8n | Going past the dashboard into automation, VA work, and branding | AI badge and certificate of completion |
AI-Powered Data Analytics Bootcamp
Ongoing now
Join anytime, live sessions with replays
AI Automations Course
August 29, 2026 to October 24, 2026
Tool Fit
When should you use Tableau instead of Excel, SQL, or Power BI?
The bootcamp teaches every tool in this table, because a working analyst reaches for all of them in a normal week. Here is the honest split, including what Tableau is bad at.
| Tool | Best at | Reach for it when | The trade-off |
|---|---|---|---|
| Excel | Calculating and cleaning a file somebody emailed you. | The question is small, the data fits one sheet, and the answer is due today. | It falls apart as a monthly report: the file grows, versions multiply, and you rebuild the same thing every month. |
| SQL | Pulling and shaping the rows before any chart exists. | The data lives in a database and the question needs joins or filters a spreadsheet cannot hold. | It is not a presentation layer. A query result is not something a manager reads and acts on. |
| Power BI | Scheduled, governed business reporting inside a Microsoft workplace. | The company already runs on Microsoft 365 and the same report has to refresh for a lot of people. | Setting it up properly is an IT conversation, so it is slower to move on a question nobody has asked before. |
| TableauThis page | Visual exploration, and dashboards the reader can interrogate without asking you. | The audience is executives, the answer is a picture, or you want a public link for your portfolio. | Tableau Public saves your workbook publicly, so it is not for confidential company data, and paid licensing for internal use is a decision your employer makes, not you. |
Decide
Which should you choose?
5 situations and the straight answer for each, including the ones where the answer is not Tableau and the ones where it is not us.
If you have never built a dashboard and want to find out this weekend whether you enjoy it, install the free Tableau Public app and start with the intermediate practice project on this page. It costs nothing and the answer numbers are published, so you can check your own work.
Browse the free practice projectsIf your office already runs on Microsoft 365 and your reports must refresh on a schedule, learn Power BI first and pick up Tableau after. Both are in the same bundle, so the order is yours to choose and you are not paying twice.
See what the bundles includeIf you cannot yet pull your own data and keep waiting on somebody to export it for you, do SQL before either dashboard tool. A beautiful chart built on the wrong rows is worse than no chart, and this is the order the bootcamp teaches for that reason.
See the full analyst pathIf you want the whole analyst toolset in one payment rather than buying tools one at a time, take the Career Bootcamp at ₱6,000, paid once. It covers Excel, SQL, Power BI and Tableau, and ends in a certificate of completion and an AI badge.
Compare the two bundlesIf you already work with data and want four more months of advanced training, automation and branding after the core path, take the Career Bootcamp Premium at ₱12,500. It is the same Tableau coverage plus the advanced recorded track, VA training and AI automation.
Read what Premium adds
Questions
Tableau training in the Philippines: common questions
The questions people actually send us before enrolling, answered without the sales voice.
It is worth learning if your work involves showing numbers to people who will never open a spreadsheet. Tableau is a visualization tool, so it pays off in reporting, business intelligence and analyst roles rather than in data entry. Learn it after Excel and SQL, not instead of them, because employers here hire for the whole analyst skill set and not for one logo on your CV. We do not guarantee placement, and no course can.
Learn whichever your workplace already runs. If the company is on Microsoft 365 and the same report has to refresh on a schedule for a lot of people, start with Power BI. If you want fast visual exploration, an executive-facing dashboard, or a public link you can put in a portfolio, start with Tableau, because Tableau Public is free to install and publishes to a shareable URL. The Career Bootcamp covers both, so you do not have to bet on the wrong one.
No. You can start Tableau on a CSV, which is exactly how the free practice projects on this site begin. You will hit the ceiling quickly at work, though, because the data usually lives in a database and the useful questions need joins. The bootcamp teaches SQL before the visualization modules for that reason: the tool is easy, getting trustworthy rows into it is the actual job.
Partly. Tableau Public is free to install, and this site hosts 3 free Tableau practice projects with downloadable datasets and published answer numbers you can check your work against, 2 of them with a graded skills check. What free material cannot do is look at your dashboard and tell you the chart is wrong. That review is what the paid bootcamp adds.
The bundle breakdown lists Tableau + AI as one of the 7 components in the ₱6,000 AI-Powered Data Analytics Career Bootcamp, priced separately at ₱1,500. Most people take the whole path, because Tableau on its own leaves you unable to get the data in the first place. If you only want the Tableau module, message the Facebook page and we will tell you what is possible for the current cohort.
Both. Sessions run live online so you can ask a question while a dashboard is being built, and every session is recorded, so a night shift or a missed week does not cost you the module. The AI-Powered Data Analytics Career Bootcamp includes 5 live sessions with recorded replays, and it is delivered online across the Philippines, not only in Metro Manila.
Yes. The bootcamp ends in a certificate of completion and an AI badge covering the whole path, including the Tableau modules, rather than a separate Tableau certificate. Certificate numbers are 9 digits and anyone can check one at /verify. To be plain about it: that is our certificate, not a Tableau vendor certification, and the thing an employer will actually look at is the dashboard you publish.
Written by JC de las Alas, Founder and Lead Instructor at Millennial Business Academy.
Last updated:
Build the dashboard first, then decide
Work through the free Tableau briefs. If you want the rest of the analyst path, live sessions and someone reviewing your work, the Career Bootcamp is ₱6,000, paid once.