

Data Analytics
10 Excel Best Practices Every Aspiring Data Analyst Should Master
By JC de las Alas, Founder and Lead Instructor
· 8 min read
Ask any hiring manager screening data analyst applicants in the Philippines what they test first, and the answer is rarely Python or machine learning. It is Excel. Payroll runs on it, BPO client reports run on it, and most small businesses run their entire operations on it. The analysts who get trusted early are not the ones who know the most functions. They are the ones with clean habits.
Here are the ten habits we drill in our bootcamp, in the order they matter on a real job.
1. Keep your raw data raw
The moment a file lands in your inbox, duplicate the sheet and name the original RAW_do_not_touch. All cleaning happens on the copy. When your numbers get questioned in a meeting, and one day they will, you can always trace your work back to the untouched source. Analysts who overwrite their raw data have no way to prove their report is right.
2. Convert every dataset into a proper Table
Select your data and press Ctrl + T. A real Excel Table gives you filter buttons, banded rows, structured references like Table1[Revenue], and ranges that expand automatically when new rows arrive. Formulas that point at Tables do not silently miss the 50 rows someone pasted at the bottom last Friday. Microsoft's own overview of Excel tables documents exactly these behaviors. That single shortcut prevents an entire category of reporting errors.
3. Clean text with functions, not your fingers
Real exports are messy. Product names arrive as Shampoo Sachet, shampoo sachet, and SHAMPOO SACHET with trailing spaces. Never fix these by retyping. Use TRIM to strip spaces, PROPER to standardize casing, and Find and Replace for known variants. Then use Data, Remove Duplicates, and record how many rows it removed.
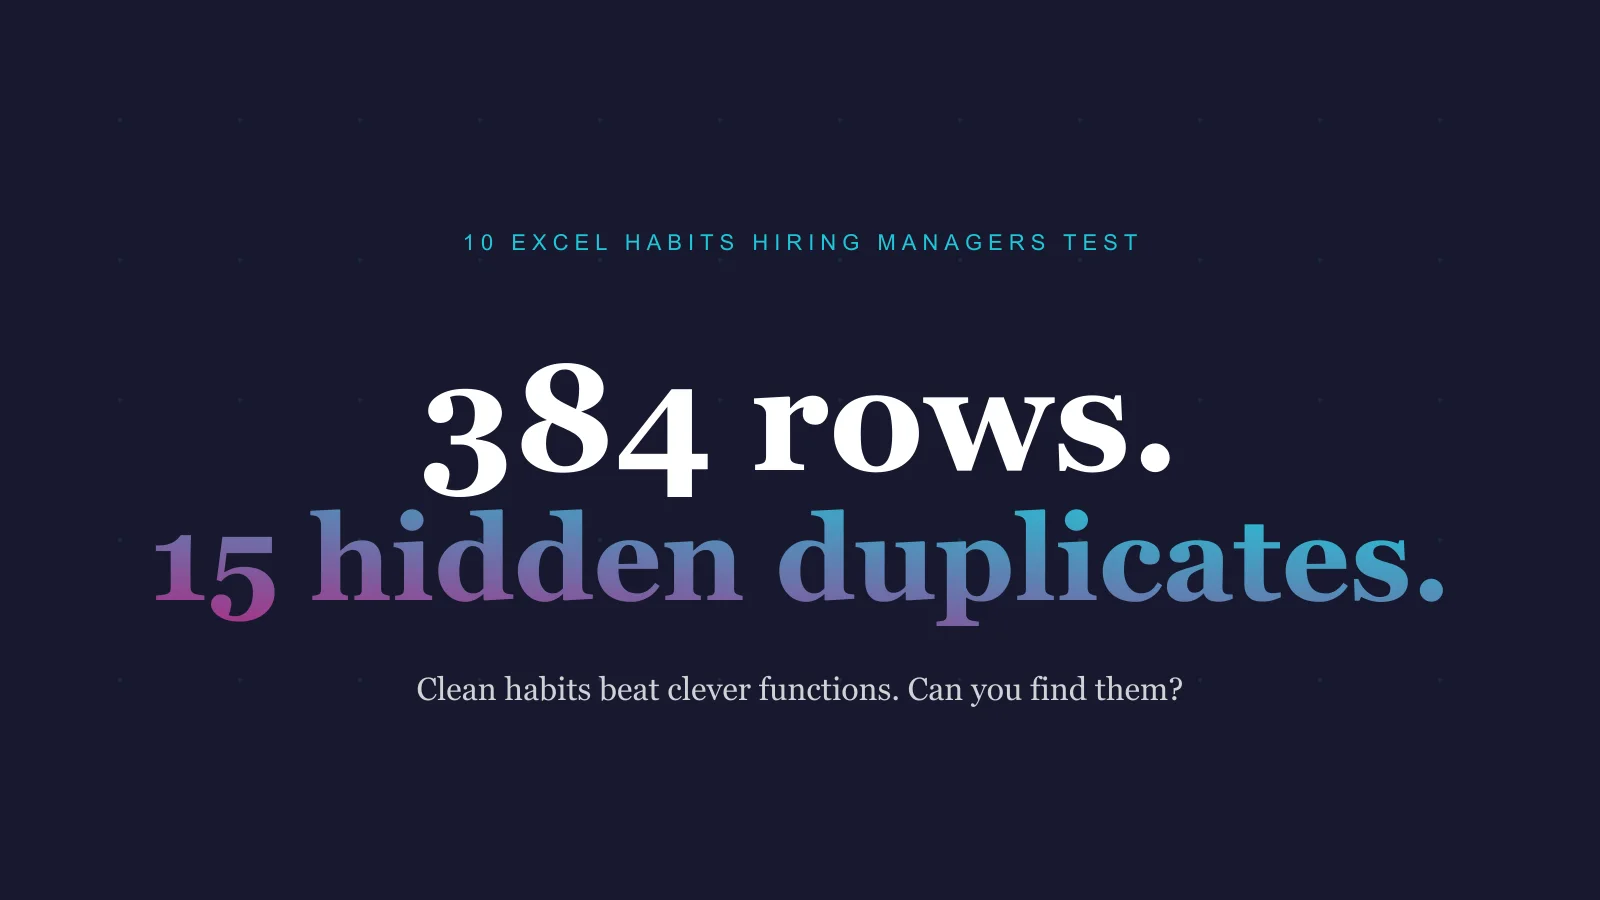
Want to feel this pain safely? Our free sari-sari store sales cleanup project ships a deliberately messy POS export with exactly 15 duplicated receipts hiding in 384 rows. Your job is to find them and report the store's real numbers.
4. One column, one meaning
Dates stored as text, numbers stored with peso signs typed in, blanks that sometimes mean zero and sometimes mean unknown: these are the silent killers of every pivot table. Decide what each column means, set the data type, and label unknowns explicitly as Unknown instead of leaving blanks. Zero and missing are different facts, and your analysis changes depending on which one is true.
5. Learn lookups the modern way
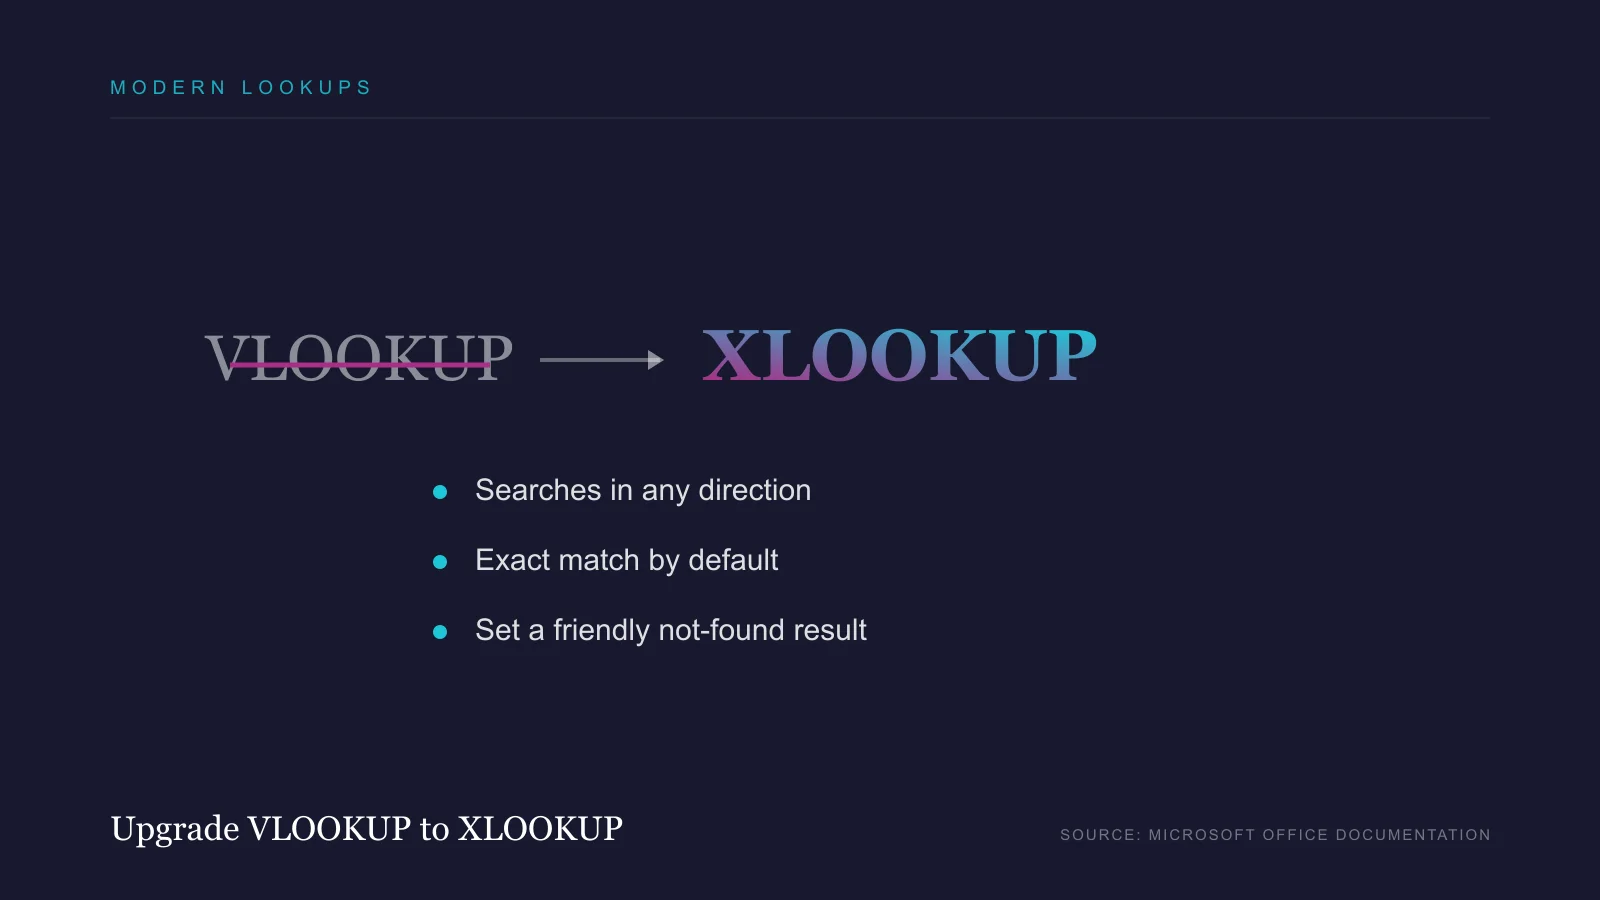
XLOOKUP replaced VLOOKUP for good reasons: per Microsoft's XLOOKUP documentation, it searches in any direction, defaults to an exact match, and lets you set a friendly result when nothing is found. Wrap older formulas in IFERROR so a missing match shows Not found instead of the #N/A that scares stakeholders. If your workplace is still on an older Excel, master INDEX MATCH; it earns respect in interviews.
6. Let pivot tables answer the actual question
A pivot table is not a formatting tool, it is an interview with your data. Who are the top products? Which day of the week sells the most? What share of payments moved to GCash this month? Each question is a pivot: rows, values, done, and Microsoft's guide to creating a PivotTable is a solid reference to keep open. Practice asking the question in plain words first, then building the pivot that answers it. Speed here is what makes you look senior in a meeting.
7. Show your checks
Before you send any report, reconcile it: the sum of your category breakdown must equal your grand total, your cleaned row count must equal raw rows minus removed duplicates, and COUNTBLANK on key columns should return numbers you can explain. Put these checks in a small block on your working sheet. Analysts who show their checks get their numbers trusted without argument.
8. Format for the reader, not for yourself
Freeze the header row. Format pesos with thousands separators and zero or two decimals, never four. Use conditional formatting for at most one or two signals, like flagging employees with eight or more lates in our attendance and overtime payroll project. A report where everything is highlighted highlights nothing.
9. Write down your assumptions
Did you exclude the duplicated receipts? Treat blanks as Unknown? Count overtime only beyond 8 worked hours? Add a small Notes section that says so. Six weeks from now, someone will ask why the June report says 133 lates, and the answer should live in the file, not in your memory.
10. Practice on messy data, not tutorials
Clean tutorial datasets teach you buttons. Messy data teaches you judgment. Start with our two free Excel projects, both built from realistic Filipino business scenarios with expected outputs you can verify: the sari-sari store cleanup and the biometric attendance and OT pay summary. If your numbers match the answer key, you did it right.
See the core skills in action
If you are starting from zero, it helps to watch someone drive Excel end to end. This beginner tutorial from Kevin Stratvert, a former Microsoft product manager, walks through tables, formulas, sorting and filtering, and pivot tables, the same fundamentals in habits 2, 5, and 6 above. Watch it once with your own messy file open, then rebuild along.
Where to go from here
Excel is the entry point, not the ceiling. In the AI-Powered Data Analytics Career Bootcamp you go from these habits to SQL, Power BI, Tableau, and AI-assisted analysis, live, with mentors, and with a portfolio at the end. If you can already do everything in this list comfortably, you are ready for the next tool.
- #Excel
- #Data Analytics
- #Best Practices
Frequently asked questions
Yes. Excel remains the most commonly screened skill for entry-level data analyst roles in the Philippines, and most companies still run day-to-day reporting on it. It is also the fastest way to learn core data concepts like cleaning, aggregation, and lookups before moving to SQL and BI tools.
Learn the concepts in either, because cleaning, lookups, and pivot tables transfer almost one to one. Philippine employers, especially corporates and BPOs, still lean toward Excel, so be comfortable in Excel for interviews even if your daily driver is Sheets.
The common screening tasks are cleaning a messy export, XLOOKUP or INDEX MATCH, SUMIFS and COUNTIFS, pivot tables, and building a small summary report. Deep VBA is rarely required for analyst roles.
With deliberate practice on realistic datasets, most beginners get job-ready in a few weeks, not months. The fastest path is working through scenario projects with verifiable outputs rather than watching tutorials passively.